How was this done
All data in this database has been manually curated. Data is gathered from scientific articles with experimentally validated results, describing at least one long- or short-lived genetic model with at least two interventions (mutations, knockout, overexpression or RNA interference). Lifespan should be significantly different than that of wild type (i.e. the genetic interventions should result in noticeable changes in lifespan/aging rate). We also include only experiments in which the multiple mutant is compared with at least one single gene mutant and, if possible, with the wild type. Besides lifespan values, we also record other factors that affect lifespan; for example, we record the temperature at which the experiment took place and the diet that was administered to the animal.
To keep a high standard of curation, we select only articles which include survival curves, and we manually check if the curve’s shape is appropriate for a normal aging pattern. If there are obvious suspicions towards pathological/dysfunctional models (sudden deaths across cohort, severe differences from literature in controls), a more thorough curation is done and the articles might be excluded. In particular, for short-lived mutants, we also check if the authors report that signs of premature aging were observed (e.g. graying of hair in mice, incremental slowness in feeding patterns or movement in worms, etc), as to further support that shorter lifespans are related to an accelerated aging process and not to specific pathologies.
For better visualization, we are also displaying our data as a network of genes and combinations of genes for each organism. The overall networks per organism are created using Cytoscape 3.5.1 and displayed on the website using Cytoscape.js. In the networks, each node represents a lifespan model (wild type or mutant), while edges show the relationship between models - linking for a certain intervention the background in which it was done to the mutant with one more changed gene (e.g.: wild type -> single mutant, single mutant -> double mutant etc).
Colors help to easily identify the direction and the intensity of lifespan change for each genetic intervention. Green indicates long-lived mutants, red short-lived ones (lifespan length is compared to that of the average wild type). The color intensity of the node is proportional with the average lifespan from all experiments in the database which include that gene or gene combination. Models with more data entries (e.g., more lifespan assays from multiple studies) can be identified by a larger node size.
Genetic interventions considered in this project are mutations (both loss and gain of function), knockout, RNA interference and overexpression. To simplify explanations for our methodology below, any animal strain upon which one of the above interventions was carried out will be referred to as “mutant” (as opposed to wild type). Depending on the number of interventions, these will be single, double, triple, etc mutants.
Given the lifespan (LS) for wild type (WT), gene 1 mutant (called G1), gene 2 mutant (G2) and the double mutant (G1,G2), we define the effects on lifespan, compared to wild type, for each model as follows:
ΔG1= (LS(G1) – LS(WT)) * 100 / LS(WT)
ΔG2= (LS(G2) – LS(WT)) * 100 / LS(WT)
Δ(G1,G2)= (LS(G1,G2) – LS(WT)) * 100 / LS(WT)
We considered interventions to be significant if ΔG1 and ΔG2 are both larger than 10%. Otherwise, intervention were considered to be not longevity-related. Synergy has been defined to take into account only combinations where single gene interventions have same direction effects (i.e., all lead to increased or decreased lifespan).
There are two distinct cases:
We will also first define the relationship considering that the double mutant is also long- or short-lived, as the two single mutants (same direction changes).
In this case, sign(Δ(G1,G2)) = sign(ΔG1) = sign(ΔG2).
As such, we define 4 types of two-gene combinations:
Please see below an exemplification of these 4 types of relationships (Fig. 1)
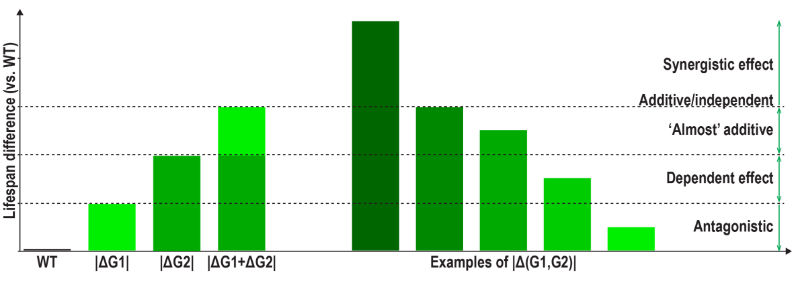 Fig 1. Explanation of synergistic and antagonistic relationships
If the lifespan of the double mutants is changed into the opposite direction compared to the lifespan of single mutants, the relationship is obviously considered fully antagonistic.
Similarly, epistasis categories (synergistic, additive, almost additive, dependent and antagonistic) could also be used for higher-level n-mutants (n>2), however, the inference rules need to be more complex, accounting for all the intermediary k-mutants (for any k<n).
Evaluation of “full” synergism. If we consider for example an n-mutant to be the result of molecular interventions in n genes, that act fully synergistic with regards to longevity, then it would be required that the lifespan of the n-mutant is greater than the sum of lifespans for any two intermediary k-mutant and (n-k)-mutant, where the subsets of k and n-k genes do not overlap (see Fig. 2A).
Approximation of a “simple” synergism. One simplification of synergism assessment would be to compare the lifespan effect of the n-gene combination only to the sum of the individual effects (see Fig. 2B), but it could incorrectly infer synergism in case of dependent effects (see Fig. 2C).
Partially known, monotonically epistatic. N-mutants can be constructed by performing a series of single gene interventions, in sequential order, with multiple paths. In this case, for a known path, if each genetic intervention k increases the lifespan effect of the previously combined k-1 interventions, then the path is monotonically positive (Fig. 2D). Similarly, a monotonically negative trend can be defined.
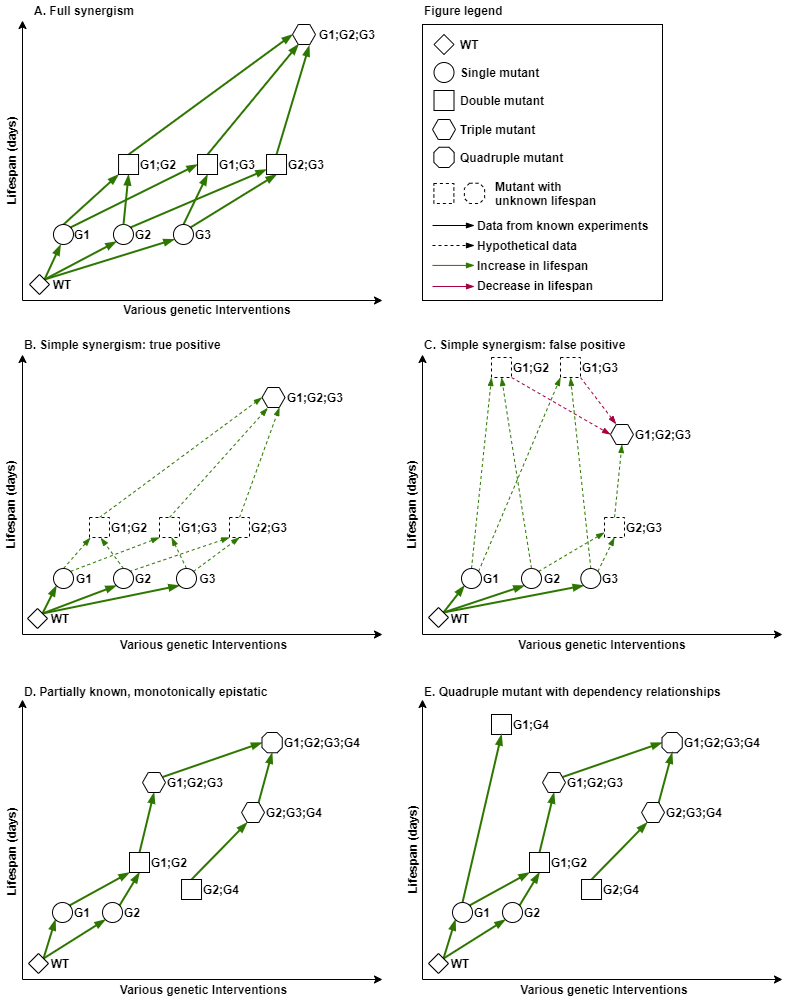 Fig. 2. Synergism and epistatic monotony
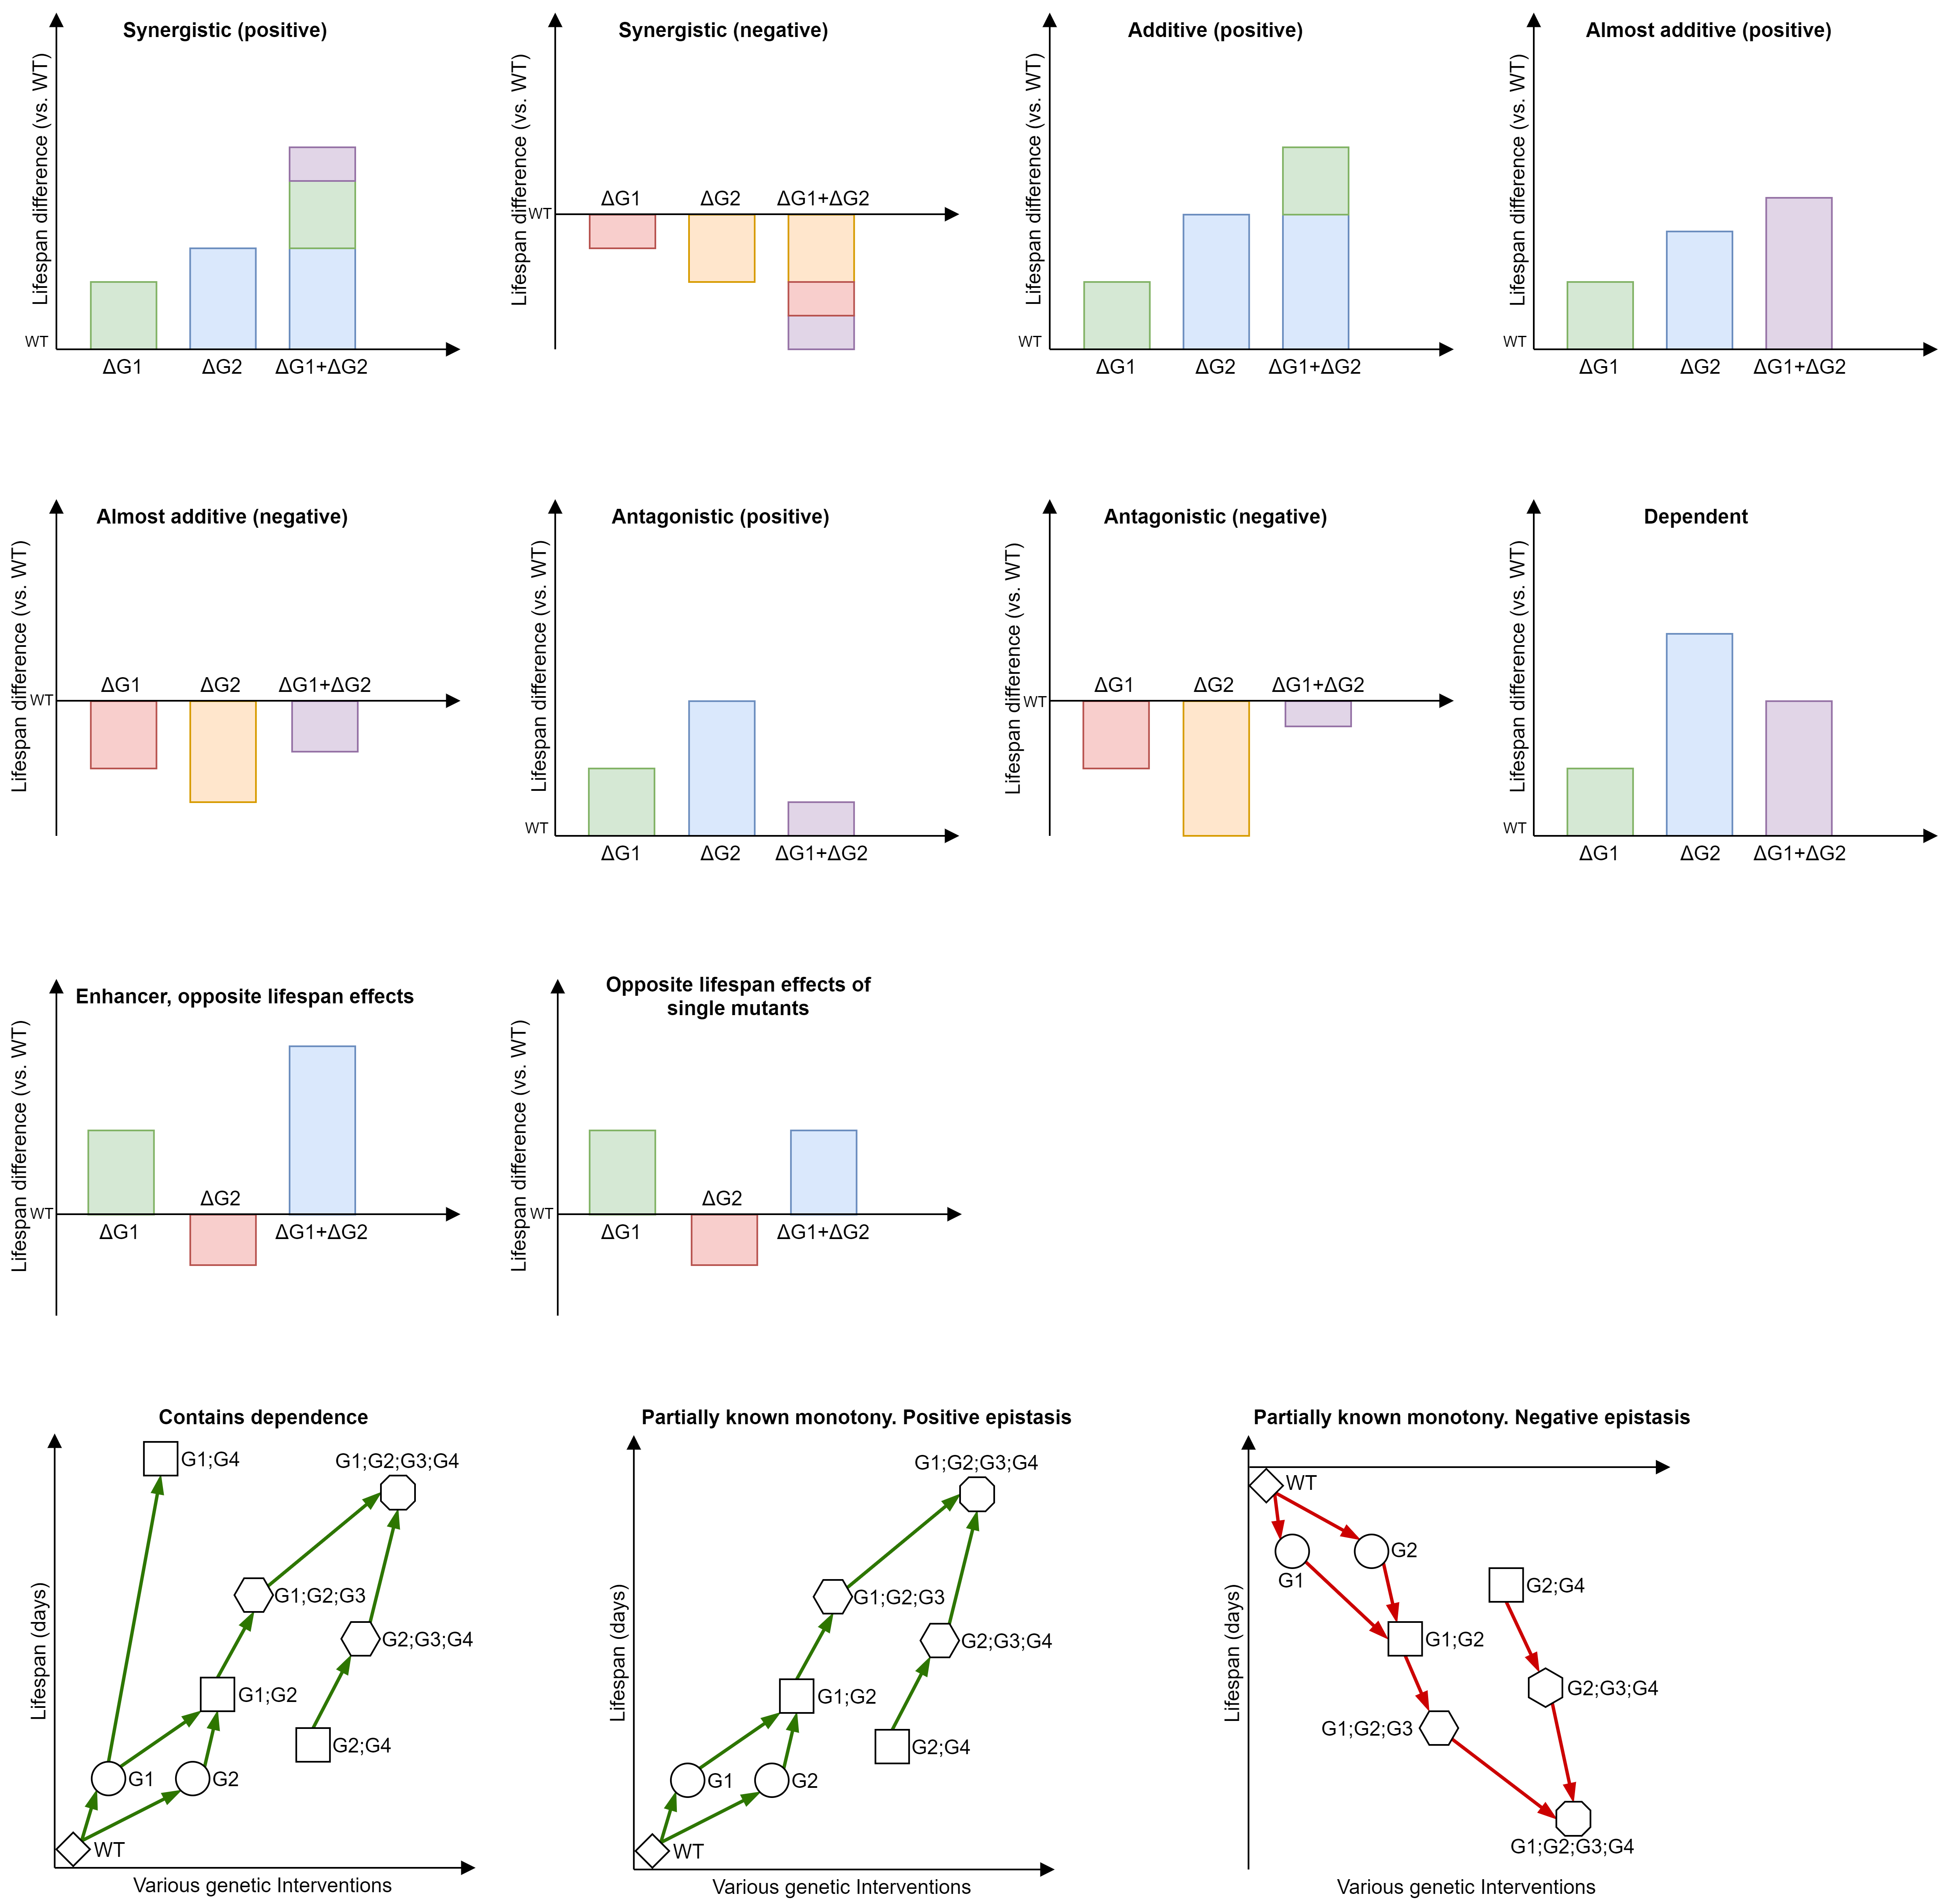
Additive (positive): The increased lifespan obtained upon the combined interventions is similar to the sum of the individual effects.
Almost additive (negative): The decreased lifespan obtained with combined interventions is greater than each of the individual effects (both decreasing lifespan), however not larger than their sum.
Almost additive (positive): The increased lifespan obtained with combined interventions is greater than each of the individual effects (both increasing lifespan), however not larger than their sum.
Antagonistic (negative): Decreased lifespan effects obtained by individual interventions are reduced to less than the minimal effect among them when a combined intervention occurs.
Antagonistic (positive): Increased lifespan effects obtained by individual interventions are reduced to less than the minimal effect among them when a combined intervention occurs.
Contains dependence: Based on available data (incomplete set of intermediary mutants), it seems that dependency relationships exist between the individual interventions (i.e. the large effect of some sub-combinations or individual effects are larger if other genes are not intervened upon).
Dependent: The lifespan effect obtained upon the combined interventions is between the effect individual effects, suggesting that the stronger intervention depends on the weaker intervention not occurring.
Enhancer, opposite lifespan effects: The effect of one gene intervention is enhanced by another gene intervention that by itself results in an opposite effect.
Opposite lifespan effects of single mutants: Individual effect on lifespan are opposite and their combined effect is either non-significant or between the individual effects.
Partially known monotony. Negative epistasis: Based on available data (incomplete set of intermediary mutants), each additional intervention seems to further increase the negative effect on lifespan.
Partially known monotony. Positive epistasis: Based on available data (incomplete set of intermediary mutants), each additional intervention seems to further increase the positive effect on lifespan.
Synergistic (negative): The decreased lifespan effect obtained upon the combined interventions is greater than the sum of the negative individual effects (all decreasing lifespan).
Synergistic (positive): The increased lifespan obtained upon the combined interventions is greater than the sum of the individual effects (all increasing lifespan).
SynergyAge database hosts high-quality, manually curated information about the synergistic and antagonistic lifespan effects of genetic interventions in model organisms, also allowing users to explore the longevity relationships between genes in a visual way.
If you would like to cite this database please use:
Bunu, G., Toren, D., Ion, C. et al. SynergyAge, a curated database for synergistic and antagonistic interactions of longevity-associated genes. Sci Data 7, 366 (2020). https://doi.org/10.1038/s41597-020-00710-z

Group webpage: www.aging-research.group